Gamma Exposure (GEX)
How dealer hedging shapes volatility, from the Greeks to the gamma flip
options
volatility
market-structure
Gamma exposure estimates how much stock dealers must buy or sell to stay hedged as the market moves. We build it from the ground up: gamma, dealer positioning, the GEX formula, per-strike walls, the gamma profile and the zero-gamma flip.
1 Abstract
Options dealers do not want to bet on direction, so they hedge. Because an option’s delta changes as the price moves, those hedges have to be adjusted continuously, and in aggregate the adjustments are large enough to move the market. Gamma exposure (GEX) estimates the size and direction of that hedging flow: how many dollars of the underlying dealers must buy or sell for every 1% move. This note builds GEX from first principles, works through the formula on a single option, then on a full options chain, and ends with the two levels traders watch most: the call and put walls and the zero-gamma flip.
2 From Delta to Gamma
An option’s delta (\(\Delta\)) is how much its price moves for a $1 move in the underlying. A call with \(\Delta = 0.50\) behaves like 50 shares per contract of 100. Delta is not constant: as the underlying rises, a call’s delta rises toward 1; as it falls, delta falls toward 0.
Gamma (\(\Gamma\)) is the rate at which delta changes:
\[ \Gamma = \frac{\partial \Delta}{\partial S} = \frac{N'(d_1)}{S\,\sigma\sqrt{T}} \]
Where:
- \(S\) — price of the underlying
- \(\sigma\) — implied volatility
- \(T\) — time to expiration, in years
- \(N'(d_1)\) — standard normal density evaluated at \(d_1\) from Black-Scholes (Black & Scholes, 1973)
Calls and puts with the same strike and expiry have the same gamma. Two properties matter for everything that follows: gamma is largest at the money, and it becomes sharply concentrated around the strike as expiration approaches.
3 Why Dealers Matter
Every listed option has a buyer and a seller. Market makers (“dealers”) sit in the middle, absorbing customer orders and hedging away the directional risk with the underlying or futures. A dealer who is long a call is long delta, so they sell the underlying to be flat.
Gamma decides what happens next:
- Long gamma. When the market rises, the dealer’s delta grows, so they sell more to stay flat. When it falls, they buy. Hedging leans against the move and dampens volatility.
- Short gamma. The signs flip: dealers must buy into rallies and sell into declines. Hedging chases the move and amplifies volatility.
Public open interest does not say who holds each side, so GEX relies on a convention. The standard one for index options:
| Customers typically… | So dealers are… | Dealer gamma |
|---|---|---|
| Sell calls (covered calls, overwriting) | Long calls | Positive |
| Buy puts (portfolio protection) | Short puts | Negative |
This is why call open interest enters GEX with a plus sign and put open interest with a minus sign. It is an assumption about positioning, not an observation, and we return to its limits at the end.
4 The GEX Formula
Gamma is “delta change per $1”. To express it as a dollar amount of hedging per 1% move, multiply by everything that scales it to a real position:
\[ \text{GEX} = \Gamma \times \text{OI} \times \text{Contract size} \times S^2 \times 0.01 \]
Where:
- \(\Gamma\) — gamma of one option, per unit of underlying
- \(\text{OI}\) — open interest, in contracts
- \(\text{Contract size}\) — 100 for US equity and index options
- \(S^2 \times 0.01\) — one factor of \(S\) turns a 1% move into dollars (\(0.01\,S\)), the other turns the resulting change in delta into dollars of underlying
The result reads: “for a 1% move in the underlying, dealers’ hedge changes by this many dollars.” Put lines are then multiplied by \(-1\), and the total GEX is the sum across every strike and expiry:
\[ \text{GEX}_{\text{total}} = \sum_{\text{calls}} \text{GEX}_i \;-\; \sum_{\text{puts}} \text{GEX}_j \]
4.1 Worked Example: One Strike on SPY
Take a single SPY strike with SPY at $769.64: the 770 options expiring in 7 days, priced at 14% implied volatility, with 25,000 calls and 18,000 puts in open interest.
| Gamma | Open interest | Sign | GEX per 1% ($M) | |
|---|---|---|---|---|
| Side | ||||
| Call | 0.0267 | 25000 | 1 | 395.8 |
| Put | 0.0267 | 18000 | -1 | -285.0 |
Step by step:
- Gamma. Black-Scholes gives \(\Gamma \approx\) 0.0267 for both the call and the put: each option’s delta changes by that much per $1 move in SPY.
- Scale to dollars per 1%. \(100 \times 769.64^2 \times 0.01 \approx\) $592,346 per unit of gamma, per contract.
- Multiply by open interest. Calls: 0.0267 × 25,000 × 592,346 ≈ +$396M. Puts: the same with 18,000 contracts and a minus sign, ≈ −$285M.
- Net. The 770 strike contributes about +$111M per 1% move: if SPY rises 1%, dealers’ hedges on this strike alone call for selling about that much SPY, and buying the same amount if it falls 1%.
Repeating this for every strike and expiry, and adding up, gives the total GEX of the whole market.
4.2 What a GEX Number Means for Flows
Once total GEX is known, the hedge flow for a move of \(x\%\) is simply \(-\text{GEX} \times x\). A positive-GEX market sells strength and buys weakness; a negative-GEX market does the opposite.
In the positive regime the bars lean against the move, which is why such markets tend to grind in narrow ranges. In the negative regime every move generates more flow in the same direction.
5 GEX on a Full Options Chain
To see the structure of a whole market, we build an illustrative SPX-style chain with the index at 5,800: four expiries (1, 7, 30 and 60 days), strikes every 25 points from 5,200 to 6,400, an equity-style volatility skew, call open interest concentrated around 6,000 (overwriting) and put open interest concentrated around 5,600 (protection). The numbers are synthetic so the article is fully reproducible, but the shape mirrors what index chains usually look like.
Summing every line gives a total GEX of +$15.1B per 1% move: for each 1% the index rises, dealers need to sell about $15.1B of exposure, roughly 51,906 E-mini futures, and buy the same amount for each 1% it falls.
5.1 GEX by Strike: Call Wall and Put Wall
Breaking the total down by strike shows where the hedging pressure lives. Calls stack positive gamma above the market; puts stack negative gamma below it.
- The call wall is the strike with the largest positive call GEX, here 5,975. As the index approaches it, dealers sell more and more into strength, so it often behaves like resistance.
- The put wall is the strike with the largest negative put GEX, here 5,600. It often marks the area where hedging pressure, and with it volatility, is heaviest on the way down.
Neither is a hard ceiling or floor: walls move as open interest changes, and new flow can run straight through them.
5.2 GEX by Expiry
Gamma per contract depends on expiry: the closer to expiration, the more gamma an option near the money carries. Splitting the total by expiry shows how unevenly it is distributed.
The 1-day and 7-day options hold 41% of open interest but 54% of net GEX, and that share swings quickly as they approach expiry. This is why GEX models that only look at one expiry are incomplete. Same-day (0DTE) options now account for a large share of index options volume, and their gamma is concentrated in a few strikes around spot.
6 The Gamma Profile and the Zero-Gamma Flip
Total GEX at today’s price is a single number. To see where the regime changes, we recompute it at a range of hypothetical index levels, here ±10% around spot. At each level, gamma is recalculated with Black-Scholes, because gamma itself depends on where the underlying is. This step needs code: the static gamma column of a downloaded chain is only valid at the current price.
The zero-gamma level (or gamma flip) is where the profile crosses zero, here about 5,731, roughly 1.2% below spot.
- Above the flip, dealers are net long gamma. Their hedging sells rallies and buys dips, and realized volatility tends to be lower.
- Below the flip, dealers are net short gamma. Their hedging chases the move, and realized volatility tends to be higher.
The flip is a level to watch, not a trigger: it moves with open interest, volatility and time, and it, and it depends on which options are included in the model.
7 Expiration Changes the Picture
Because so much gamma sits in the front expiries, the profile can change abruptly when they expire. Removing the 1-day and 7-day options shows what the market looks like after the next monthly expiration (OPEX):
When large gamma positions expire, the “cushion” of dealer hedging thins out. Markets that were pinned in a tight range into expiration often see volatility pick up afterwards, simply because the stabilizing flow is gone.
8 Reading a Live GEX Screen
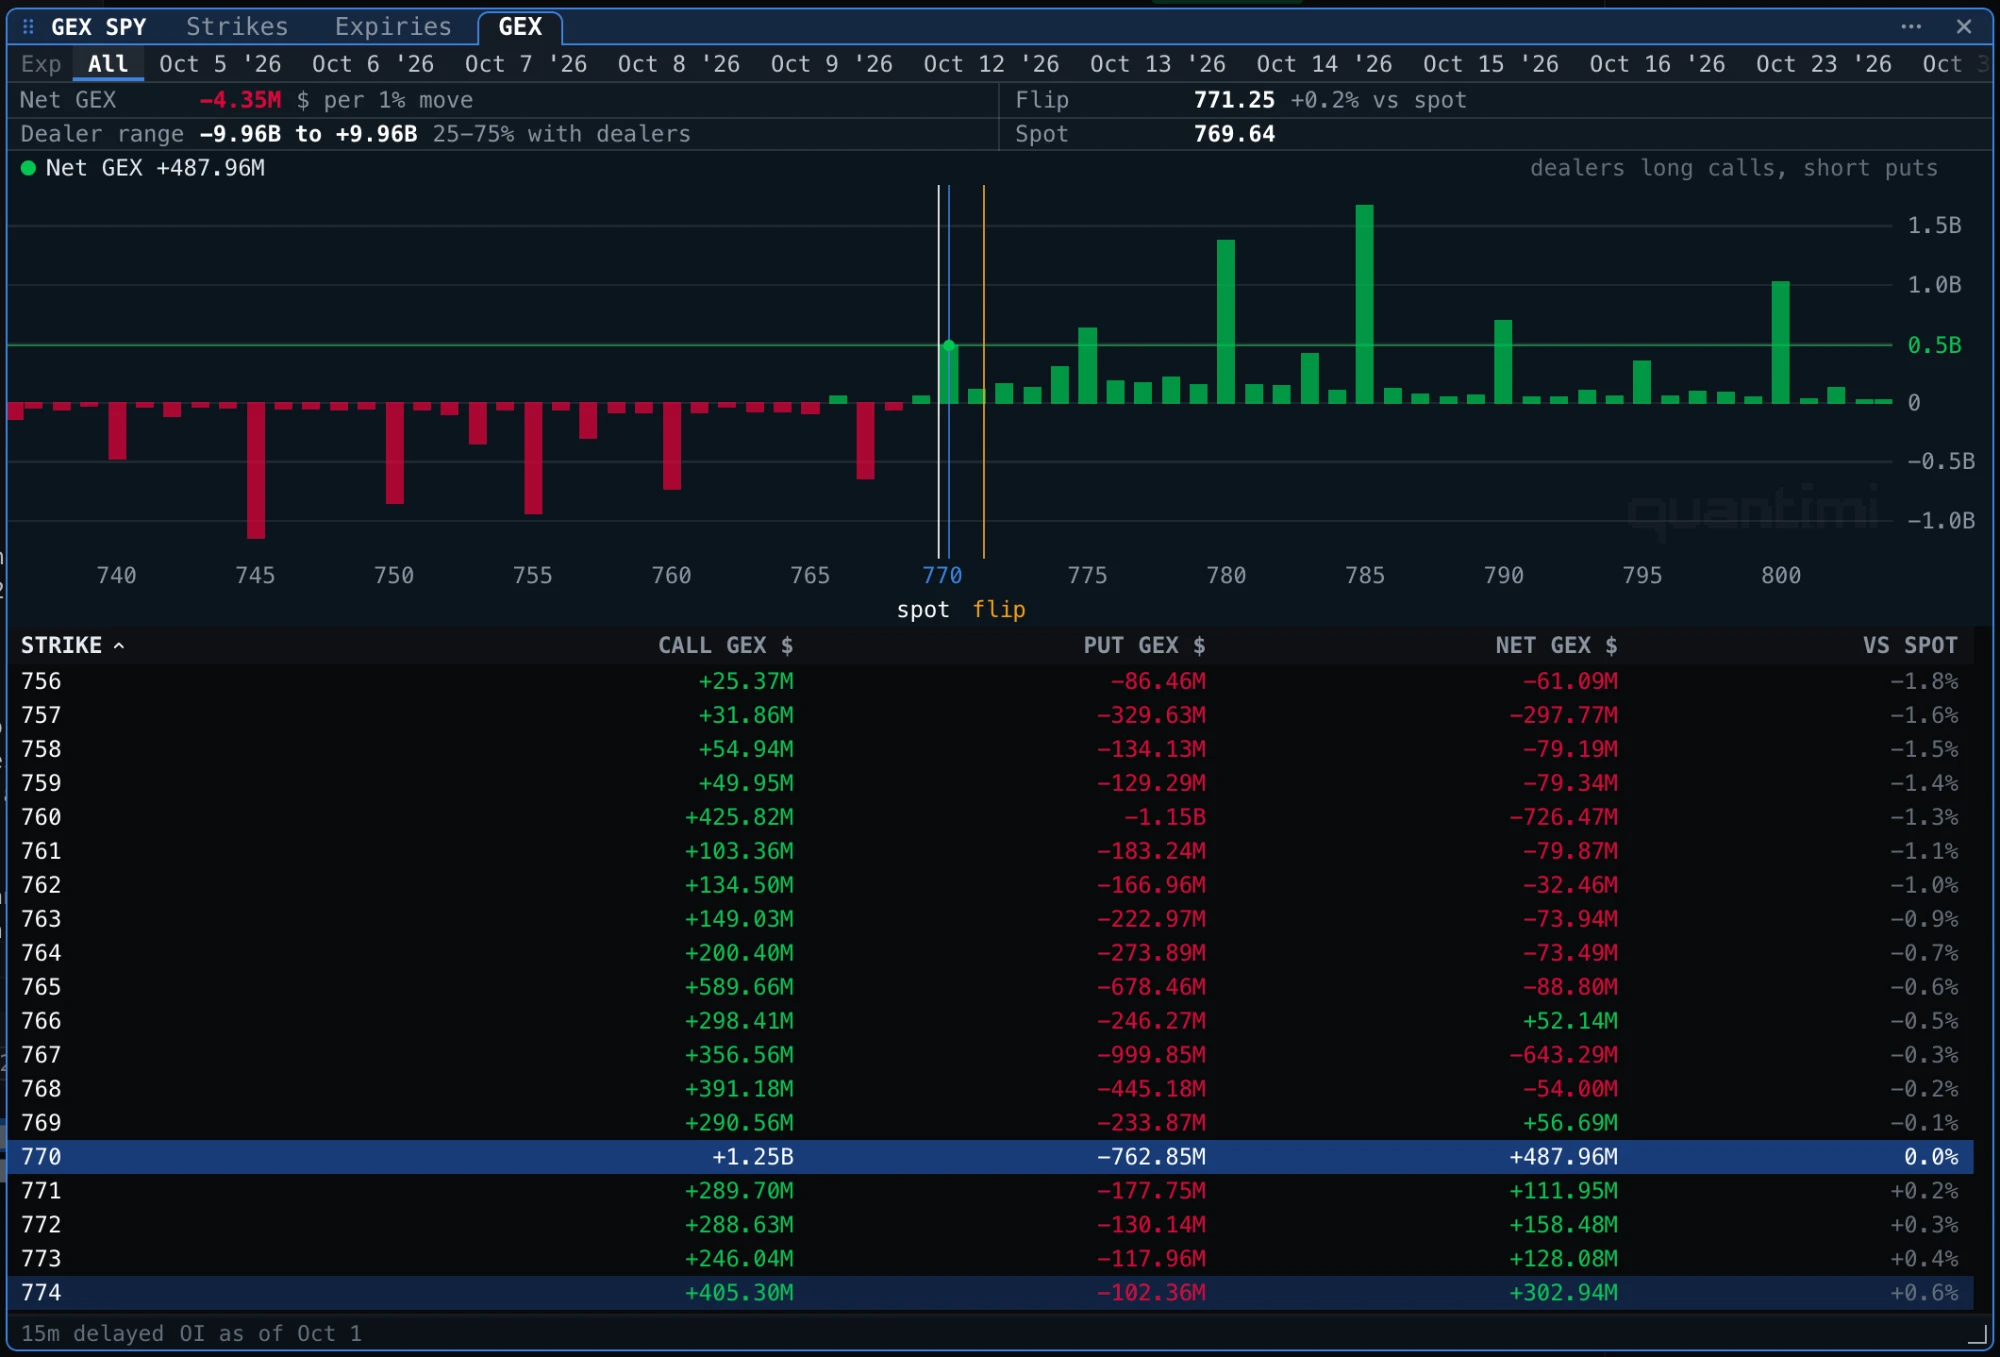
Here is the same analysis on the real SPY options chain, as shown by GEX SPY in the Quantimi Terminal (all expiries, open interest as of October 1, 2026):
How to read it:
- Total GEX is close to zero. Net GEX is −$4.35M per 1% move: for a market the size of SPY, dealer hedging is roughly balanced. Neither the dampening nor the amplifying effect dominates.
- Spot sits right at the flip. SPY is at 769.64 and the zero-gamma flip at 771.25, only 0.2% above. A small rally moves the market into positive gamma, where hedging starts to dampen moves; a decline pushes it further into negative gamma.
- The 770 strike is the pivot. It carries +$1.25B of call GEX against −$763M of put GEX, netting +$488M, the largest positive net right at the money.
- Put gamma stacks below. The biggest negative bars sit at 745, 755 and 750, plus −$726M net at 760. That 745–760 zone is where dealer hedging would add the most selling on a decline.
- Call gamma stacks above. The tallest positive bars are at 785, 780 and 800. The 785 strike is the call wall, the level where dealer selling into strength is heaviest.
- Positioning uncertainty is shown, not hidden. The dealer range, −$9.96B to +$9.96B, shows how much the total depends on assuming that 25% to 75% of open interest sits with dealers. That is the single biggest assumption behind any GEX number.
9 Using GEX in Practice
| Reading | What it suggests | What it does not say |
|---|---|---|
| Large positive GEX, spot above the flip | Moves are likely dampened; ranges and mean reversion | That the market will go up |
| Negative GEX, spot below the flip | Moves can extend; realized volatility tends to rise | That the market will go down |
| Spot near a call wall | Heavy dealer selling into strength around that strike | A hard ceiling |
| Spot near a put wall | Heaviest hedging pressure on the downside | A hard floor |
| Big front-expiry share of GEX | Regime can change quickly after expiration | When new positions will be opened |
GEX describes volatility regime and levels, not direction. It is most useful as context: sizing positions, choosing between range and trend strategies, and knowing which levels the options market cares about.
In the Quantimi Terminal, GEX SPY shows dealer gamma by strike with the call wall, put wall and flip, and OPX SPY shows the open interest behind it.
10 Limitations
- Positioning is assumed, not observed. Public open interest does not say who is long or short. The “dealers long calls, short puts” convention is usually roughly right for index options and can be wrong for single stocks, especially around events.
- Open interest updates once a day. Intraday GEX changes come only from price and implied volatility, not from new positions opened during the session.
- Model choices matter. Results depend on the volatility used for each strike, which expiries are included, and whether GEX is stated per $1 or per 1% move; the two conventions are not interchangeable.
- Short-dated gamma is unstable. Near expiry, gamma explodes near the money and vanishes away from it,, so 0DTE contributions can swing sharply within the day.
- Other flows exist. Vanna and charm (delta changes from volatility and time), new positioning, liquidity and macro news can overwhelm the effect of gamma hedging.
11 Conclusion
Gamma exposure turns the Greeks of an entire options market into a single, practical question: when the price moves, which way will the dealers’ hedges push it? The recipe is simple: compute gamma for every option, scale it by open interest, contract size and \(S^2 \times 0.01\), sign calls positive and puts negative, then sum. Repeating that across a range of prices gives the gamma profile and its zero-gamma flip; breaking it down by strike gives the call and put walls. Used with its assumptions in mind, GEX is one of the clearest windows into why some markets grind quietly and others move violently.
References
Black, F., & Scholes, M. (1973). The pricing of options and corporate liabilities. Journal of Political Economy, 81(3), 637–654.